
The Ultimate Trading Guide
A consice guide that covers my personal research on the fundamentals of trading.
By Theo Bokman
Disclaimer
Not financial advice.
The information, strategies, and insights shared within this textbook are provided for educational and informational purposes only. This material is NOT intended to serve as financial advice or guidance for trading or investing and should not be interpreted as such. You are fully responsible for any decisions you make based on the content within this text.
Vault Collective by Essencial or any of its parties thereof, do not guarantee profits or success and shall not be liable for any losses, damages, or liabilities that may arise from the application of the strategies or information in this textbook. Trading and investing in cryptocurrencies involve significant risks, including but not limited to market volatility, loss of principal, and potential financial instability.
By using the information presented in this textbook, you agree to take full responsibility for your own financial decisions. Always conduct your own research, consult with licensed financial professionals, and carefully consider your risk tolerance before making any investment or trading decisions. The methods shared in this book are personal strategies and may not be suitable or appropriate for all individuals or market conditions.
No warranties or guarantees are provided regarding the accuracy, completeness, or reliability of any information in this textbook. All content is presented “as-is,” and it is crucial to be aware that the cryptocurrency market is constantly changing and unpredictable.
By proceeding with the materials in this textbook, you acknowledge and accept these terms and conditions. Ecomwarts and the author assume no responsibility for any financial outcomes or losses that may result from following the information provided.
The Goal
Words from the author
If capital is something that you struggle with – maybe you’re young or haven’t landed that entry level job yet. I would highly suggest self-learning using this guide combined with YouTube to familiarise yourself with the world of Futures and Crypto as a whole. Set aside a portion of capital for “learning fees” (trading losses) that you don’t mind losing initially while you progress and get some “skin in the game” all while continuing to build your base level of income.
If capital is not an issue then you may skip through this page entirely. The rationale behind the creation of this resource is so that any starting capital will be put towards meaningful progress over meaningless losses. I made a lot of mistakes starting out. So I seriously dedicate this book to that clueless self of mine when I first started out, and now it will serve you.
The main goal for this guide is to make the entry-level requirements to trade Crypto Futures as low and as easy as possible for newcomers and seasoned traders alike. To enable you to test new waters and ultimately determine if this is something that you can pursue as a hobby, side-hustle or even a lifelong career pathway.
What will set this guide apart from the rest is that I take pride in having educated over 1000+ individuals over the last year. Of which my personal connections with our mentorship students now allows me to transform thousands of explanations onto paper, which will give you the best chance at success.
My greatest hope is that this guide propels you to become an even better trader than me one day and in half the time. I can say with confidence, this textbook would have saved me months of trial and error.
Chapter 1
Why Crypto?
Cryptocurrency has grown from something that nobody knew about into a revolutionary financial tool, creating entire markets and redefining how we understand assets and value. Traditional assets like stocks have long been the mainstay of investments for centuries. Cryptocurrencies have opened doors to opportunities that never existed before. From decentralized finance (DeFi) projects to the latest trend of memecoins.
Owning a stock means you have a piece of a company and these companies have products. For instance, buying an iPhone or Mac contributes to Apple’s sales. But cryptocurrencies like Bitcoin or Solana don’t have any real tangible assets at all. They’re digital assets on decentralized networks, with no CEO, government, or bank in charge. This structure gives crypto holders more control over their investments.
One big measure of value in both stocks and crypto is market capitalization, or “market cap.” The market cap represents the total value of an asset’s supply. Picture a basket with 10 apples, each worth $1. The “market cap” of that basket is $10 (10 apples × $1). A cryptocurrency’s market cap is calculated by multiplying the total number of coins by each coin’s price. Higher market caps often mean larger, more stable assets, while lower market caps can be riskier but offer higher potential returns.
Here’s where it gets interesting for investors: if you wanted the same percentage of a small market cap coin as you’d have with a big one, you’d need to buy many more coins. In practical terms, this can make smaller-market-cap assets more appealing to new investors looking to gain a larger stake without huge upfront costs.
Blockchain is the backbone of all cryptocurrencies, the principle behind it is their ability to keep track of all transactions on the chain visible to everyone but impossible to tamper with. In simple terms, think of it as how your fingerprints are unique to you, and how there cannot be another person born with the exact same fingerprints as you. This openness builds trust without needing a central authority, like a bank.
Bitcoin, the first cryptocurrency, is limited to a maximum of 21 million coins. This fixed supply means that in the event that Bitcoin becomes a global currency governments can’t “print” more, unlike traditional currency, which can be devalued by inflation when more money is printed. This fixed nature is why crypto fans see Bitcoin and similar assets as secure against inflation offering stability in supply, if not always in price. An example on how this could change real-world factors is that Russia would no longer be able to print money to fund its military efforts in Ukraine and the war would already be over.
Chapter 2
App Setup
Multi-Chain/Custodial Wallets
Crypto.com
YOU NEED TO BE 18+ (or you can get a parent to sign up for you). I don’t use Coinbase because the fees are outrageous but if you are having problems with Crypto.com I would suggest using Coinbase as a backup. Features are the same and the purpose of the app is the same.
https://www.coinbase.com/en-sg/
Available on Google Play & Apple App Store
Coinbase
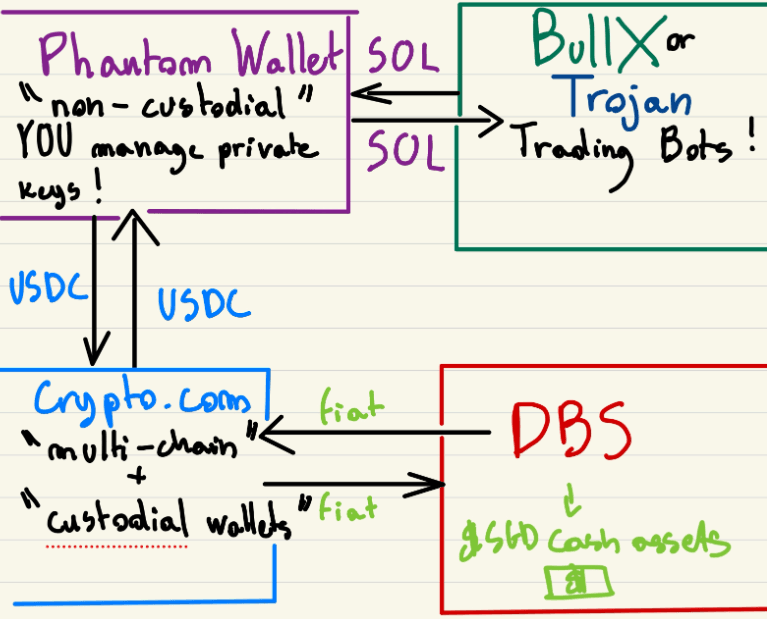
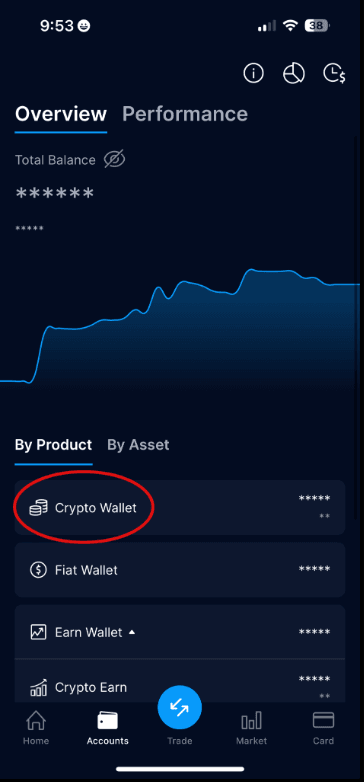
YOU NEED TO BE 18+ (or you can get a parent to sign up for you). I personally use Crypto.com as my main wallet because it was the first one I downloaded and I am very familiar with it. It creates a custodial wallet for you, allows for trading (although we don’t use it to trade memecoins because their fees are high), and staking. The point of a multi-chain custodial wallet is that Crypto.com manages your private keys which means better security and ease of use. I should also mention that it is supposedly “Singapore’s Premier Crypto Trading Platform”. This is the app I use to store a lot of my profits long-term.
If you do want to support me for free you can use my referral code when you create your account with: rkz4cgjrsy
Available on Google Play & Apple App Store
Trading Wallets
Binance
YOU NEED TO BE 18+ (or you can get a parent to sign up for you). I personally use Crypto.com as my main wallet because it was the first one I downloaded and I am very familiar with it. It creates a custodial wallet for you, allows for trading (although we don’t use it to trade memecoins because their fees are high), and staking. The point of a multi-chain custodial wallet is that Crypto.com manages your private keys which means better security and ease of use. I should also mention that it is supposedly “Singapore’s Premier Crypto Trading Platform”. This is the app I use to store a lot of my profits long-term.
If you do want to support me for free you can use my referral code when you create your account with: rkz4cgjrsy
Available on Google Play & Apple App Store
Bybit
YOU NEED TO BE 18+ (or you can get a parent to sign up for you). I don’t use Coinbase because the fees are outrageous but if you are having problems with Crypto.com I would suggest using Coinbase as a backup. Features are the same and the purpose of the app is the same.
https://www.coinbase.com/en-sg/
Available on Google Play & Apple App Store
Non-Custodial Wallets
Phantom Wallet
I personally use Phantom Wallet everyday as a middle man that swaps my USDC for Solana and then also is the main wallet that sends Solana to all my Trading Bot Wallets. I also use it daily to stable my Solana to USDC when I am done trading for the day and to house my NFT holdings long-term. Essentially Phantom Wallet is a non-custodial cryptocurrency wallet that people (including myself) primarily use for the Solana blockchain. Another main feature is that it allows us users to manage our assets and interact directly with decentralized applications through their integrated browser all while being able to retain full control of our private keys. It is also important to note that Phantom also supports NFTs (non-fungible tokens), enabling us to view, collect, and trade Solana-based NFTs directly within the wallet. Not to mention Phantom Wallet is also a chrome extension on PC so you can access your wallet from there too.
Available on Google Play & Apple App Store
How To Buy Solana Without Fees:
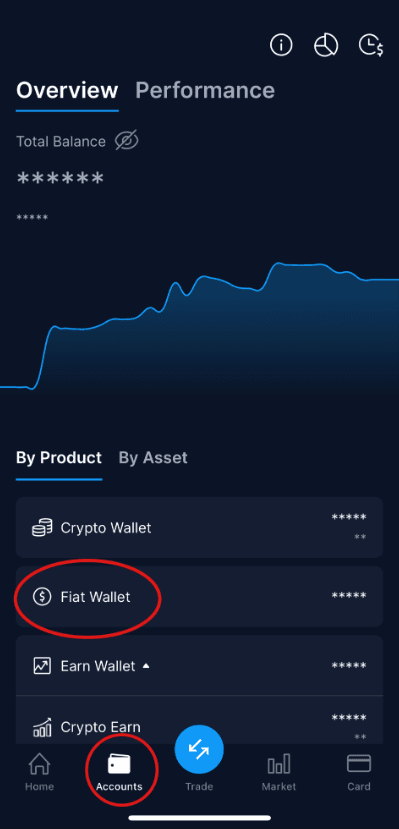
Step 1
Open your fiat wallet, and follow the instructions on screen to add SGD as your new currency. It will ask you to follow steps to add one of Crypto.com’s bank accounts as a local recipient so that you can deposit cash from your bank directly into Crypto.com without fees.
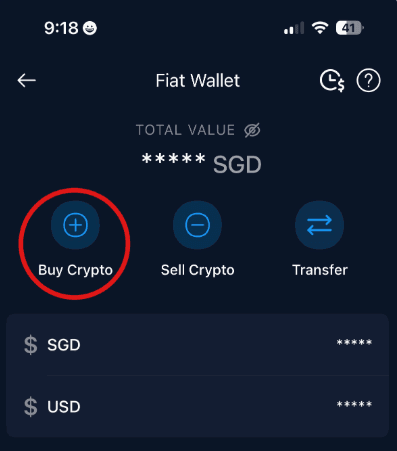
Step 2
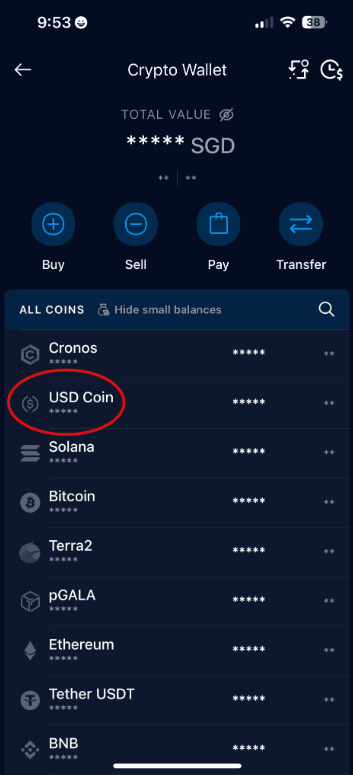
After depositing SGD from your bank to Crypto.com you can now buy USDC without any fees.
Step 3
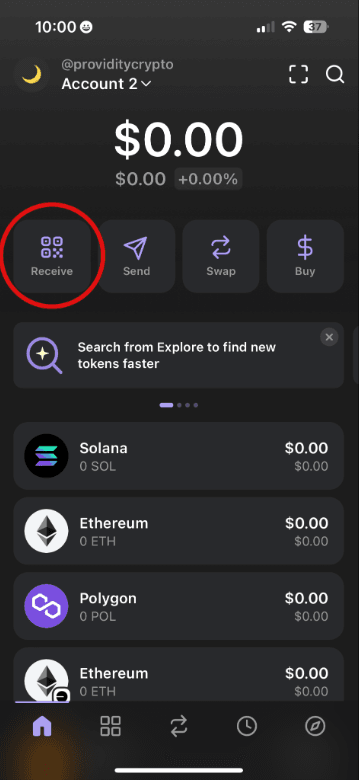
Repeat the process for 3$ worth of Solana that you will need for gas fees on your Phantom wallet. Then select the Crypto you wish to send to your Phantom wallet and go to Transfer>Withdraw>External Wallet>”+” Sign to Whitelist a New Wallet.
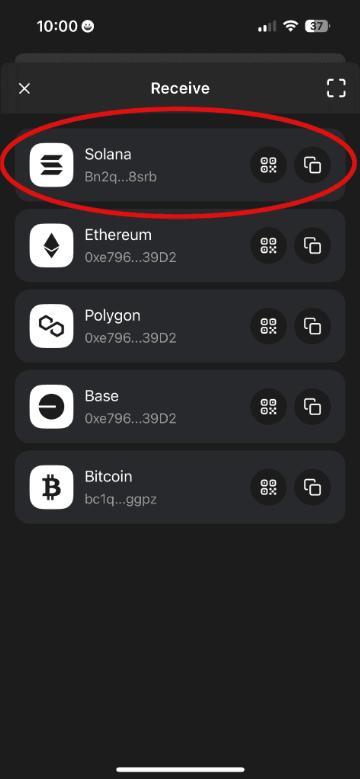
Make sure you select Solana network and paste the correct Wallet address from Phantom.
Then send the desired amount to your Phantom Wallet.
You can find your Phantom Wallet Solana address here:
Step 4
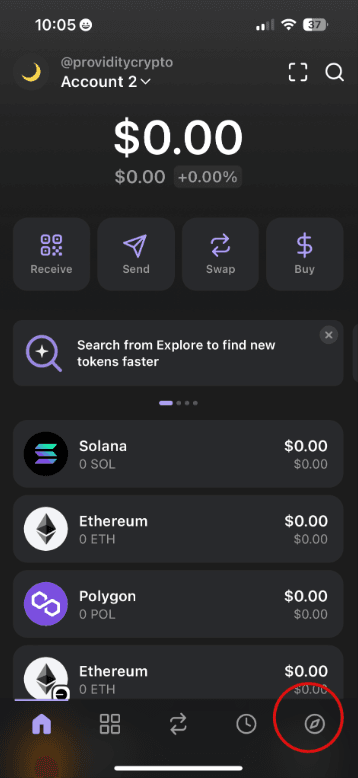
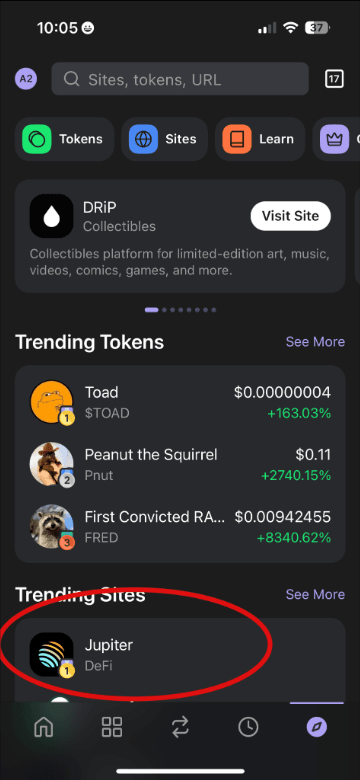
Once you have a little SOL and all your USDC in your Phantom Wallet navigate to the in-app browser. Click on Jupiter Swap.
Step 5
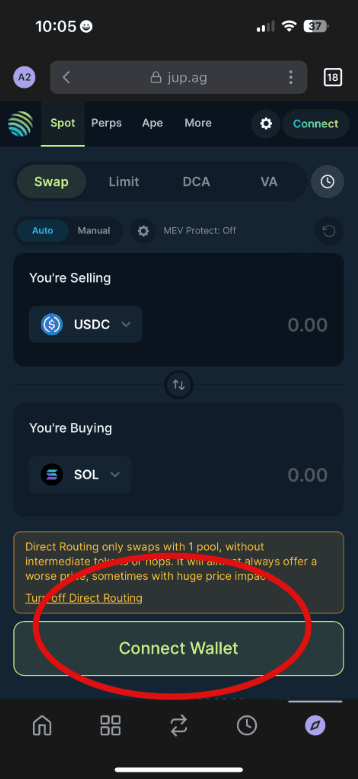
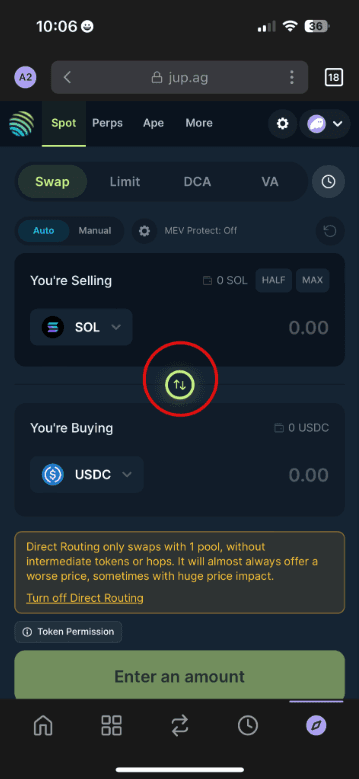
You can now use Jupiter Swap to swap your USDC into SOL without any fees. Make sure you connect your wallet first and then you can also use the switch button to swap back and forth.
Chapter 3
Trading Fundamentals
Psychology Tips:
Here's a few videos that really leveled up my psychology. I highly suggest and recommend you watch these.
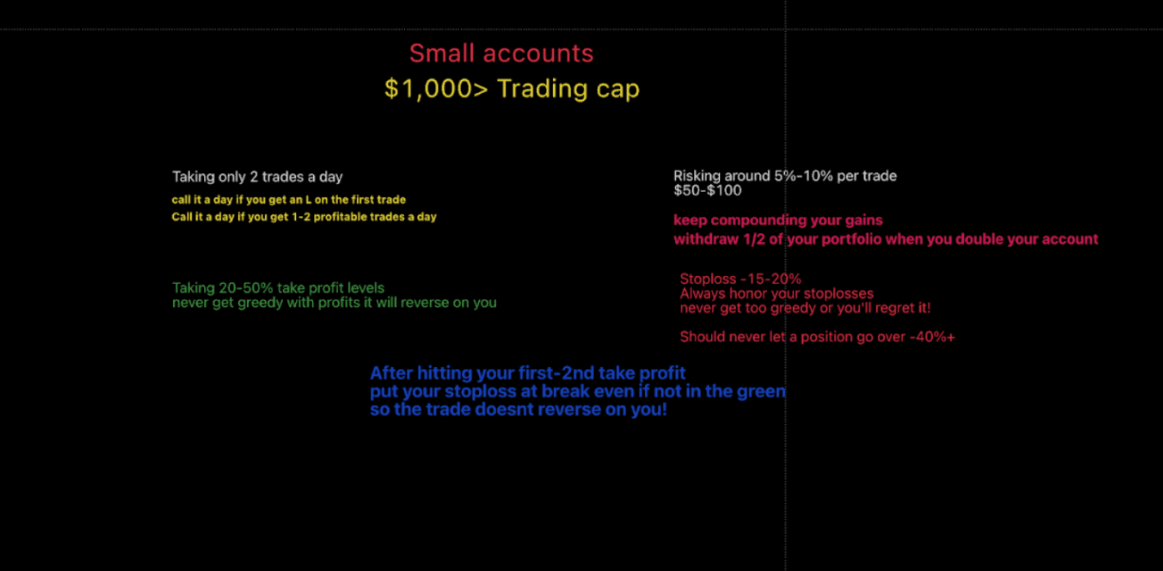
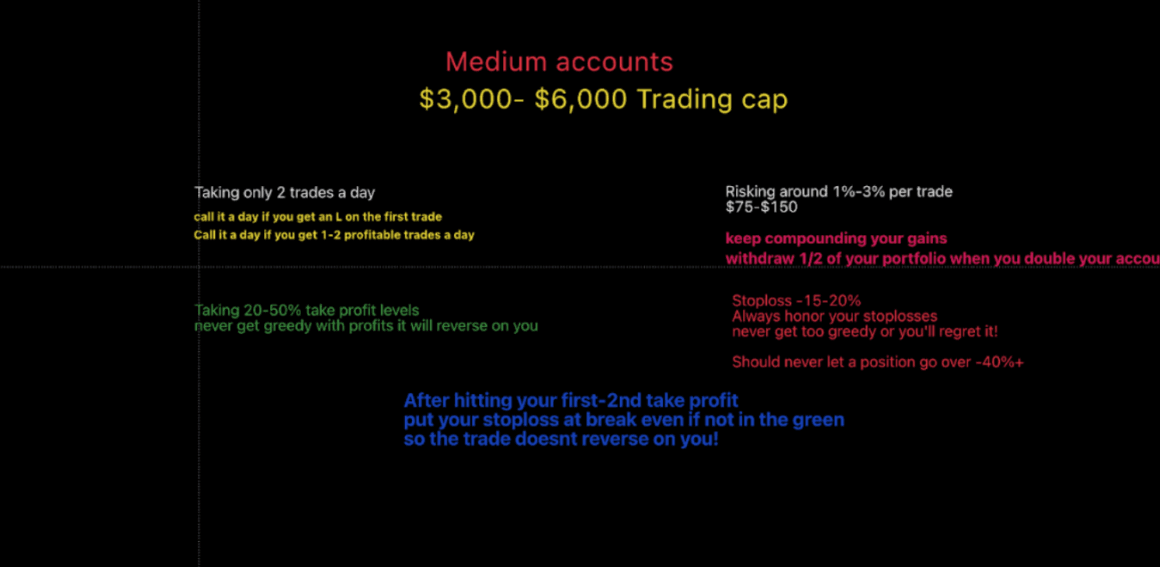
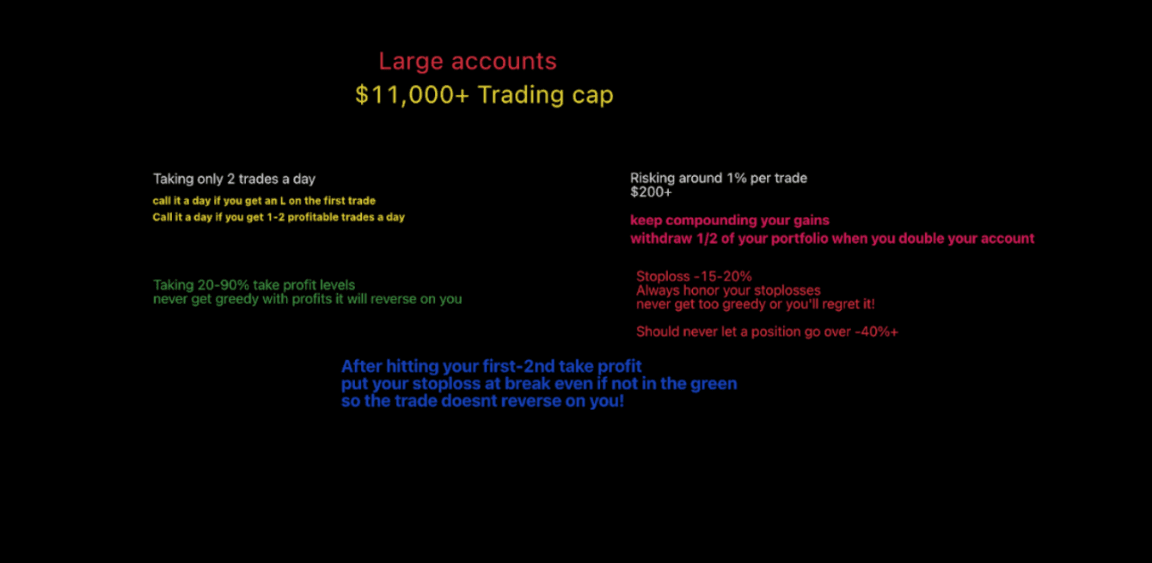
Risk management
Risk management if the most crucial part during trading
During trading you want to know how much $ your gonna risk into each trade, when to enter then exit
And most importantly where to put your stop loss
Always trim during every tp being hit
For small accounts sell your position at first to second tp
Put the stop loss at break even after first tp being hit
Put the stop loss in profit after 2nd,3rd tp being hit
Only enter trades with A+ setups for small accounts
Smart Money Concepts (SMC)
Father of Smart Money Concepts: Inner Circle Trader (ICT)
Smart money is the capital that is being used by (INSTITUTIONAL INVESTORS). This includes, market mavens (experts), central banks, hedge funds, or any other financial professionals.
What is the importance of knowing this?
Smart money is referring to a much greater scale of capital than what retail investors are capable of investing.
Therefore understanding how smart money moves in and out of markets will allow you to understand what influences and moves financial markets.
By Definition
The term, “smart money” comes from gamblers that had a deep knowledge of the sport they were betting on or insider knowledge that the public was unable to tap into. The investing world is similar. The populace perceives that the smart money is invested by those with a fuller understanding of the market or with information that a regular investor cannot access. As such, the smart money is considered to have a much better chance of success when the trading patterns of institutional investors diverge from retail investors.
Hence why Central Banks are the most common market movers. Banks deal with money. Banks use our money to make more money. Therefore from a completely uneducated standpoint, it would make complete sense that banks have an advantage over retail investors considering retail investors are the ones moving their money within the bank’s systems.
The most important thing to know about SMC is understanding how the big money moves, over the retail money, will make you more profitable in the long run. Riding the coattails of smart money investors will allow you to scoop up the ‘dumb money.’
Step 1 of Smart Money Concepts:
The whole point is that you have to identify what the charts are telling you, furthermore is this story strong or weak?
Is the structure Strong or is the structure Weak?
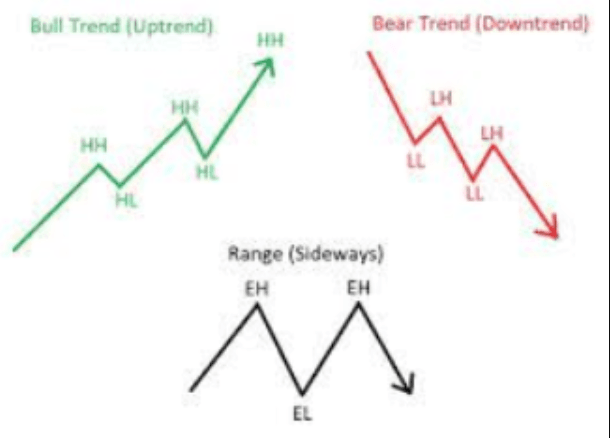
The most obvious and basic picture is identifying the trend. If we are in a downtrend and lower lows are being created, that is the first good sign although if lower highs are being broken that is not a good sign.
This is a common misunderstanding and one I encountered, as I would see, oh A lower low was created, who cares. It does, every action has an equal and opposite reactions, every move has a meaning behind it.
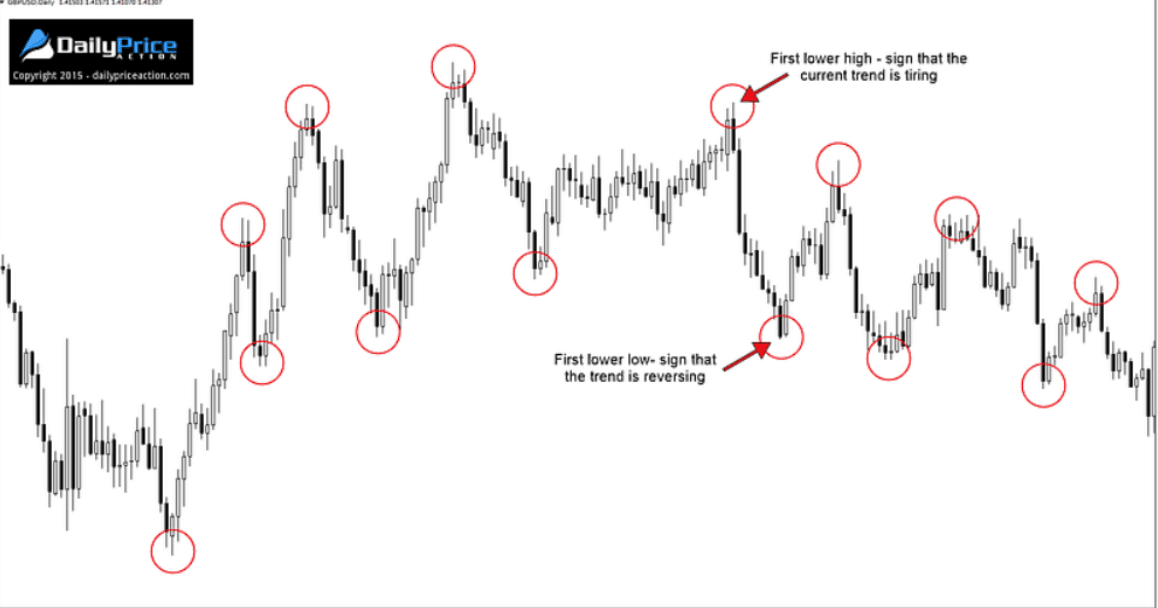
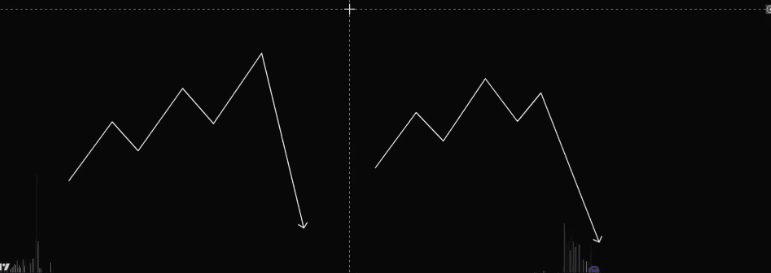
Next, you must identify whether the trend is strong or weakening.
If we are in an uptrend and a Higher High isn’t made, it shows a weakening of a trend, and therefore a possible reversal.
Although if it hasn’t broken the higher low, I still wouldn’t classify it as a trend shift, therefore we wait for one of those two things to occur.
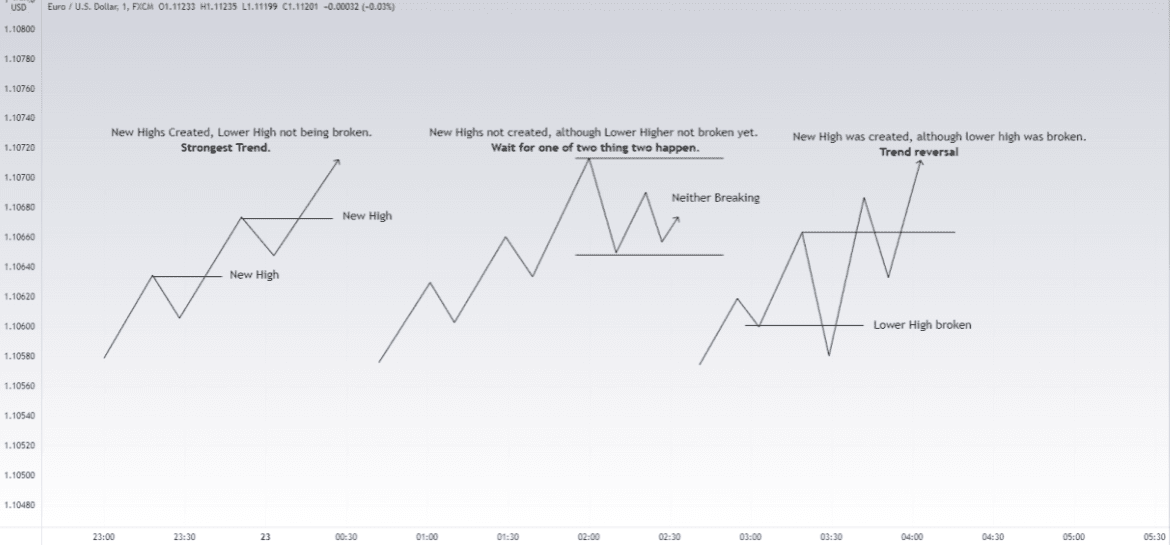
Lastly, you must identify which type of trend we are in, for example:
The first trend I would be looking for is a continuation, considering the trend is strong.
The second trend I would be cautious about, and wait for the structure to shift or break above the high.
The third trend I would be looking for a reversal as the lower high was broken and therefore the structure has been violated.
To identify that a trend is strong you must look for a Break of Market Structure. If we are in a uptrend we want to see a break of market structure by breaking and closing above previous highs.
Market Structure Shift: (MSS)
Also known as ChoCH
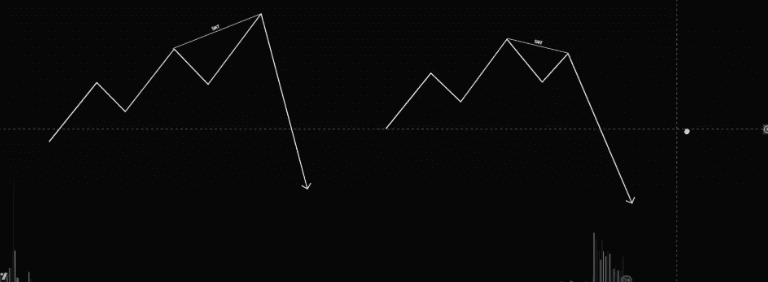
This tells us a shift in market structure. A Market Structure Shift is when we are in a uptrend (making higher highs and higher lows) and proceed to shift market structure by closing below the previous higher low as seen below:
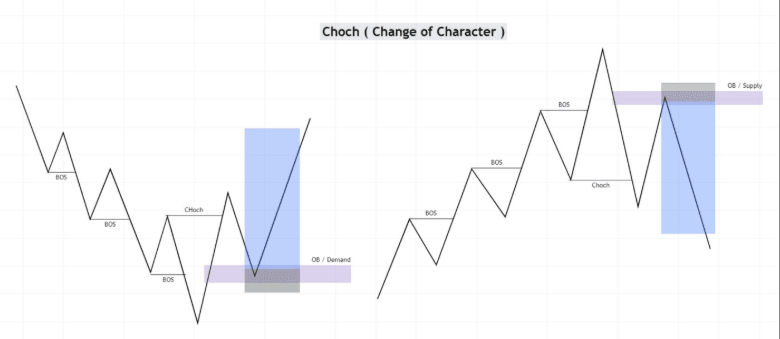
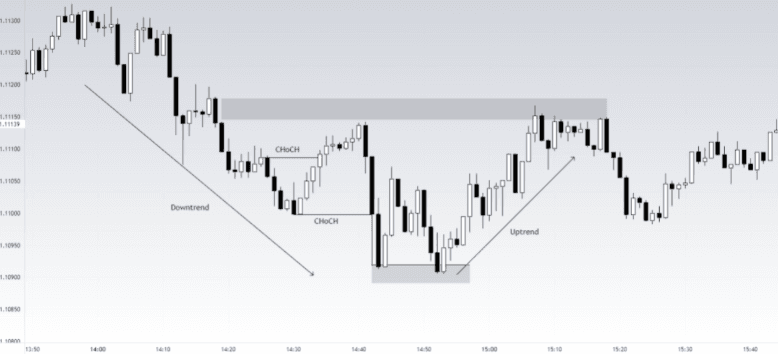
Failed to make a higher high, or failed to break structure. Therefore a reversal was bound to appear. Change of structure is in a downtrend, it broke the lower high and the lower low. It bounced off a liquidity pool which is explained if you scroll down.
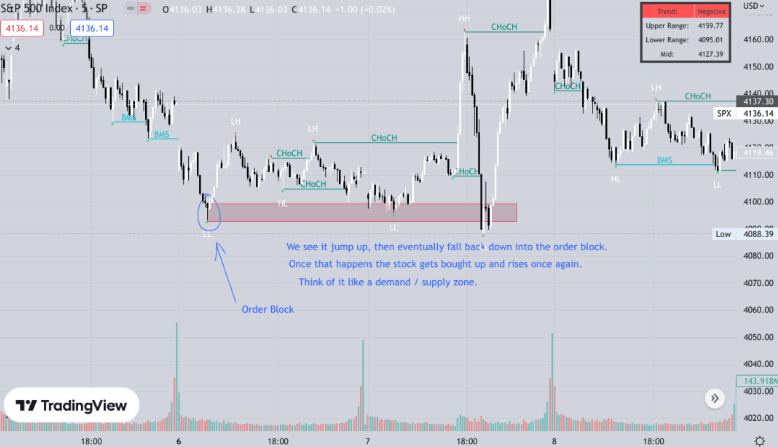
Order Blocks:
The order block is the last candle going in the opposite direction prior to a trend shift.
Bullish Order Block – The lowest candle or price bar with a down close that has the most range between open to close and is near a support level. The validation of a bullish order block occurs when the high of the lowest down candle or price bar is traded through by a later formed candle or price bar.
The concept can be reversed for a bearish order block. Order blocks are significant because they indicate a point in the market and can be used for entry and risk management in trading.
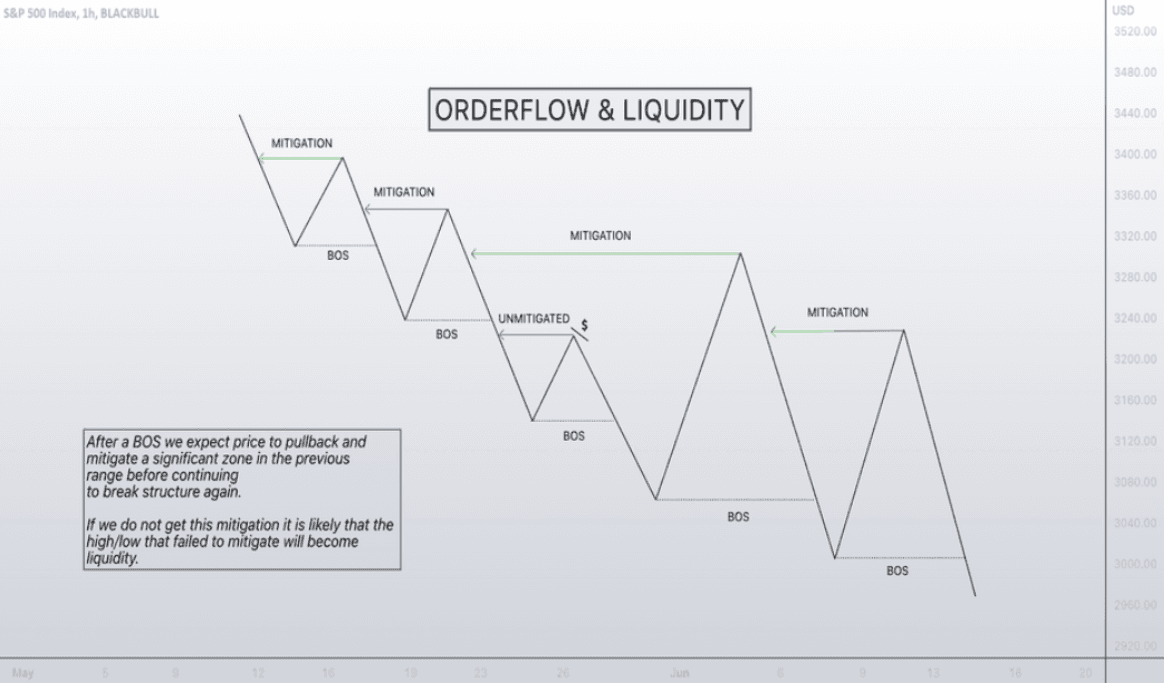
Liquidity
Liquidity is liquid cash…. liquidity in the market is found in areas where cash (stop-losses) are being held.
High levels of liquidity arise when there is a significant level of trading activity and when there is both high supply and demand for an asset, as it is easier to find a buyer or seller.
Levels to find Liquidity
* Monthly – h/l
* Yearly – h/l
* Daily – h/l
* Hourly – h/l
* Pre-market- h/l
Examples:
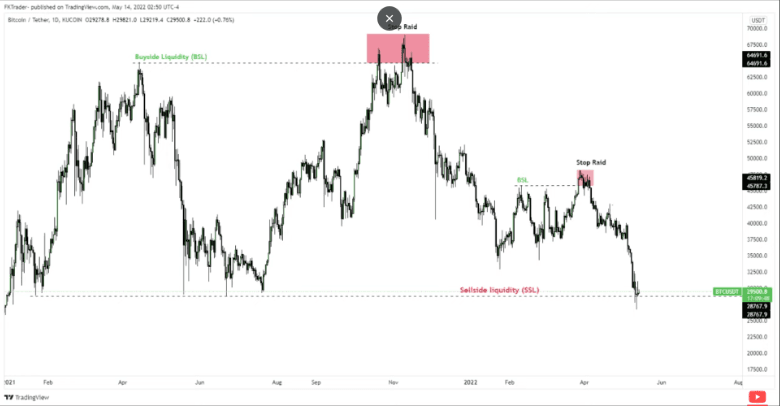
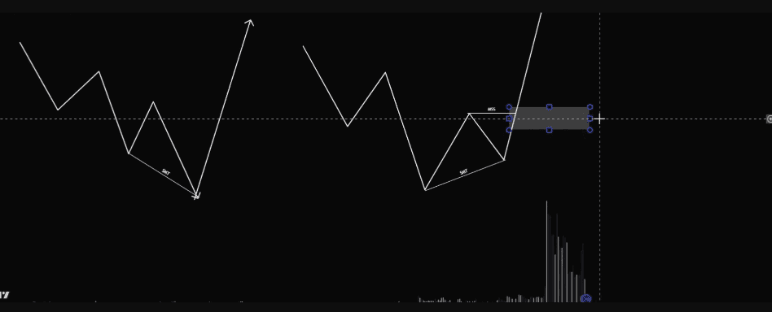
here we perfectly see us sweep an level of sellside liquidity which is when we take out a previous major low and reverse.
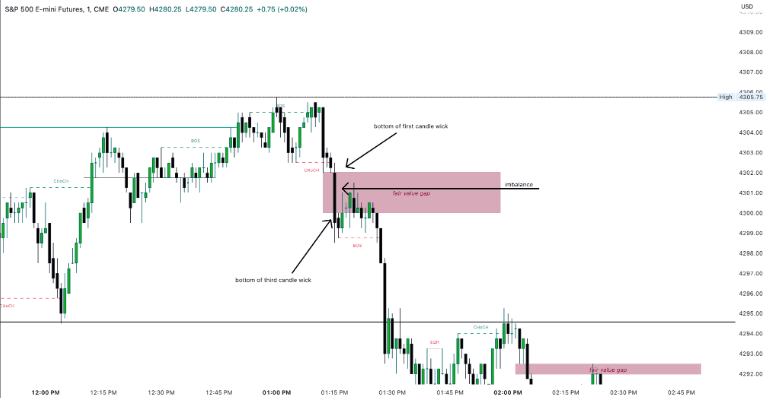
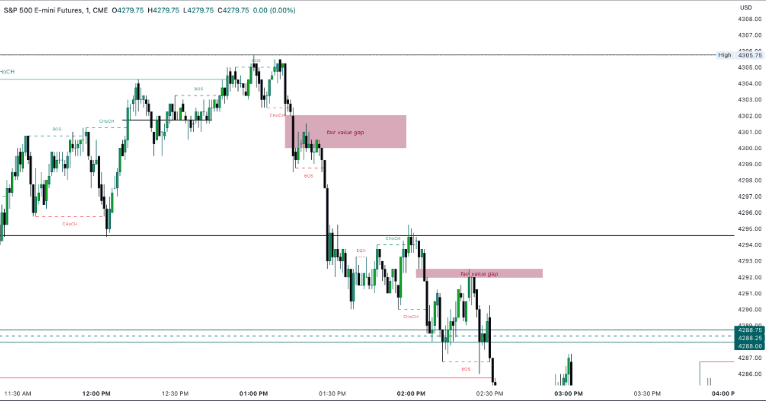
Fair Value Gaps: (FVG)
Also known as imbalances.
It is a price range where orders are accumulated and in short is a imbalance in the market that needs to be corrected.
Tends to appear after one candlestick breaks and closes through a support or resistance level.
Fair value gaps work in three candlesticks.
Order blocks
An order block is the candle prior to the expansionary move down. Uhhhh…. what does that mean?
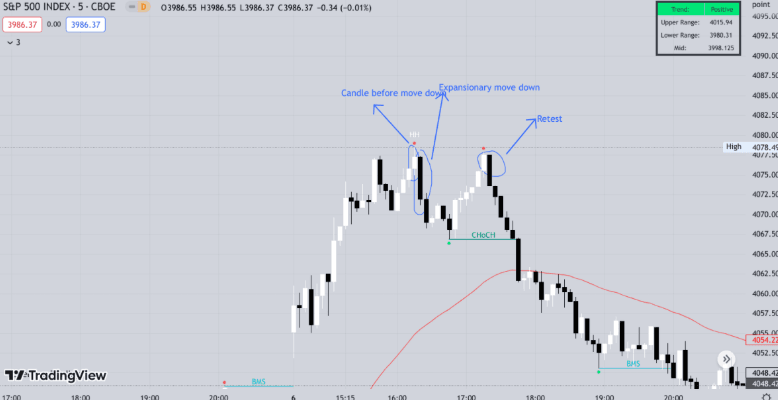
Here’s what each thing means^
Now here’s what the order block will actually look like:
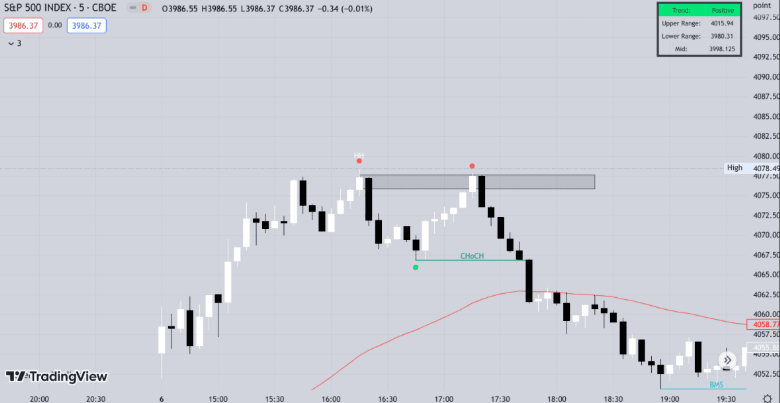
Try if possible to use higher time-frames. 5 minute and 15 minute tend to be pretty reliable… 1 minute works but can be broken easily.
Order blocks on higher timeframe:
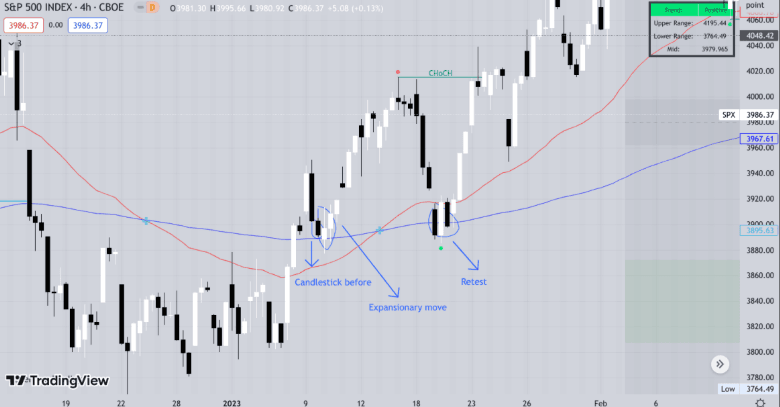
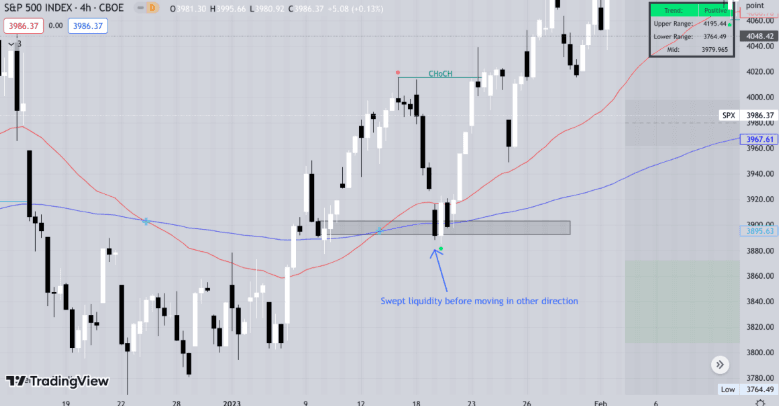
side note: stock doesn’t always sweep liquidity or retest order blocks… often times it happens but not always.
SMT Divergence
An SMT is a divergence in the market… means smart money tool.
A divergence is a difference between two or more things.
Can be found in correlated pairs/ indices.
Because I trade futures all the examples in here will be on ES and NQ.
Strongest SMTs can be found on higher time frame like 15m and above… still works on 1m and 5m.
Bearish divergence:
Can be found at highs… when one indice took out a liquidity point / trading higher while the other indice is lagging behind and yet to take out the liquidity / high then you can call that a bearish SMT.
One makes a HH
One makes a LH
Entry:
After the SMT is formed you can take longs or shorts once you see a MSS or wait for a retracement into a fvg formed.
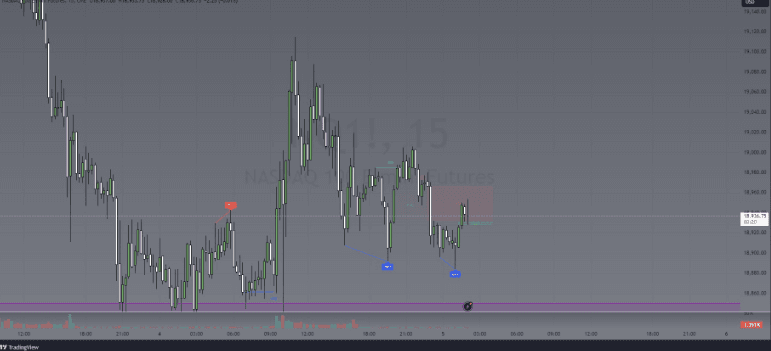
Example:
ES takes out a low while NQ does not take out a low forming a SMT.
That was on the 15m… if you zoom in on 1m or 5m after a SMT you don’t exactly need to wait for a MSS you can just enter once we see a DOL and we retrace into a fvg.
Once you’re in then target the previous high or low.
Fair Value Gaps: (FVG):
╰➣ Also known as imbalances.
╰➣ It is a price range where orders are accumulated and in short is a imbalance in the market that needs to be corrected.
╰➣ Tends to appear after one candlestick breaks and closes through a support or resistance level.
╰➣ Fair value gaps work in three candlesticks.
╰➣ Fair value gaps almost always get retested in order to fill the imbalance before moving in the direction more…
Fair Value Gap Drawing:
╰➣ First Candle – Bottom of first candles wick
╰➣ Second Candle – Space where no outta candles are touching
╰➣ Third Candle – Top of third candles wick
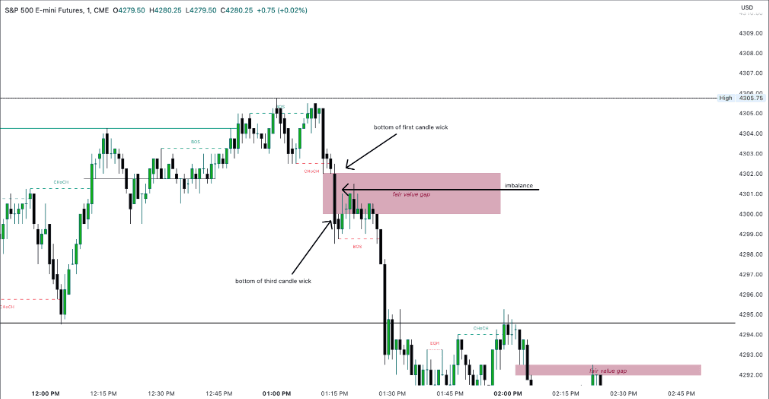
╰➣ Fair value gaps almost always get retested in order to fill the imbalance before moving in the direction more.
╰➣ We can use imbalances / fair value gaps as entries, take profits, stoplosses, etc…
In Summary:
╰➣ Fair Value Gaps are most commonly used amongst price action traders and are defined as instances in which there are inefficiencies, or imbalances, in the market. These ‘imbalances’ simply suggest that buying and selling are not equal.
╰➣ Fair Value Gaps are created within a three-candle sequence and are commonly visualized on the chart as a large candle whose neighboring candles’ upper and lower wicks do not fully overlap the large candle.
╰➣ Fair Value Gaps can be found on any timeframe and at any point of the day.
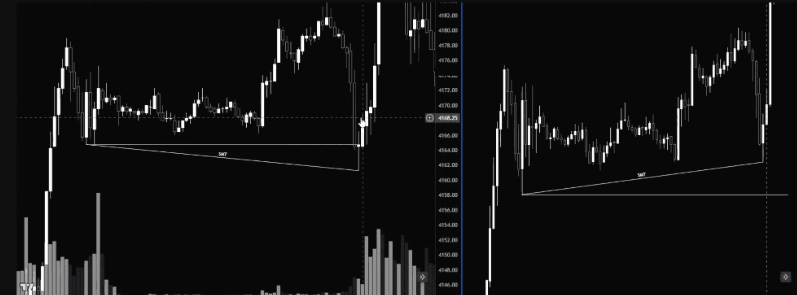
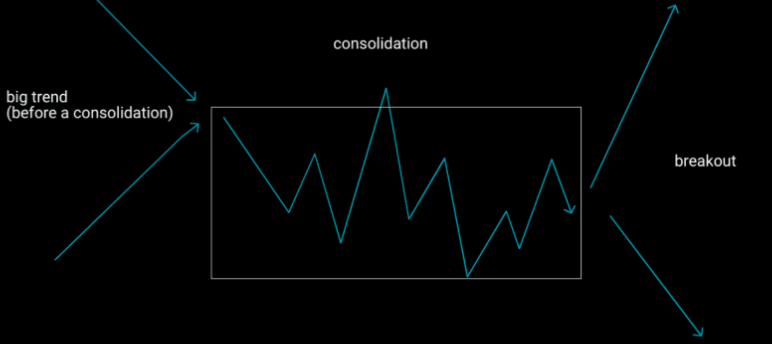
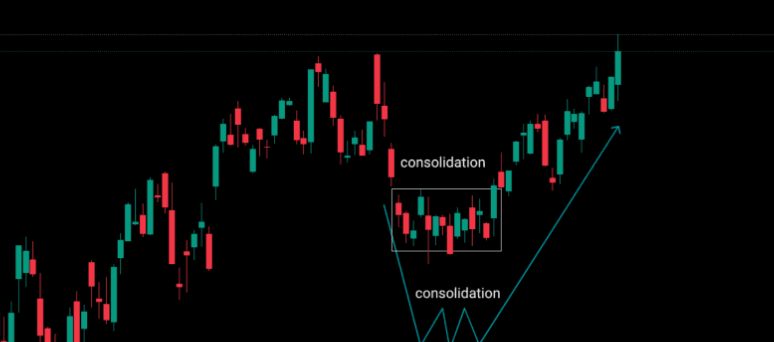
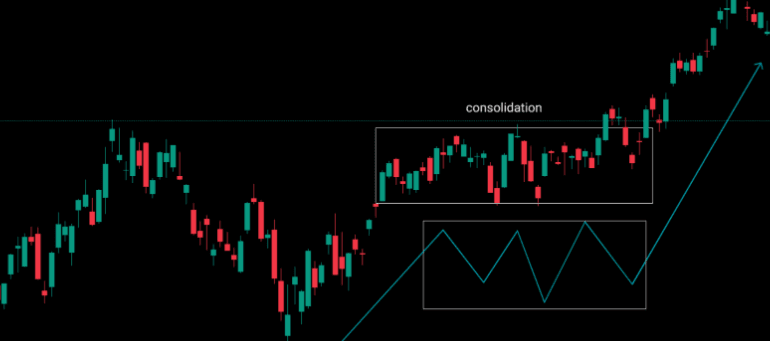
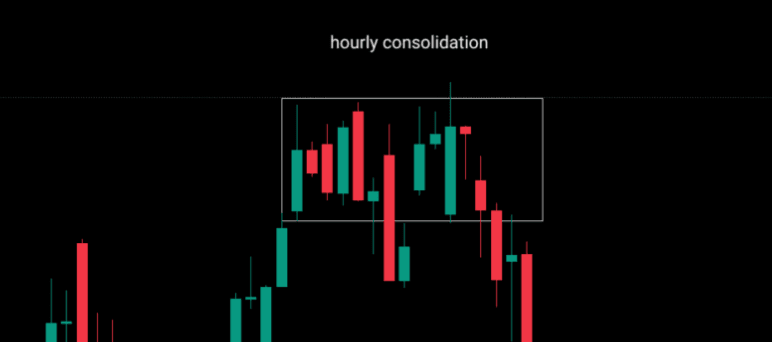
Consolidation:
Spotting consolidations 🥇
Consolidations normally last about couple hours to days
We always see a trend after and before a consolidation
Consolidations form when its on major support and resistance at the time
Failed to make a higher high, or failed to break structure. Therefore a reversal was bound to appear. Change of structure is in a downtrend, it broke the lower high and the lower low. It bounced off a liquidity pool which is explained if you scroll down.
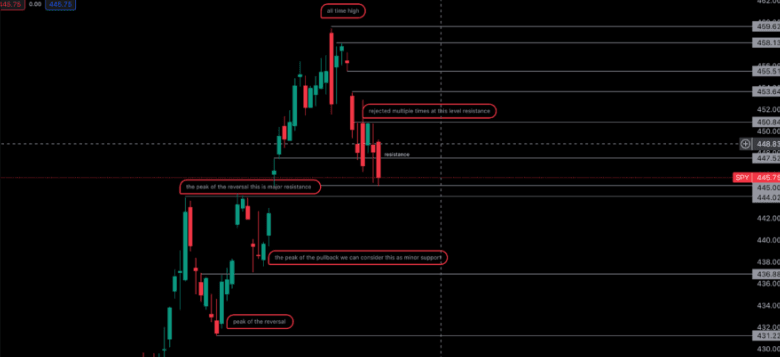
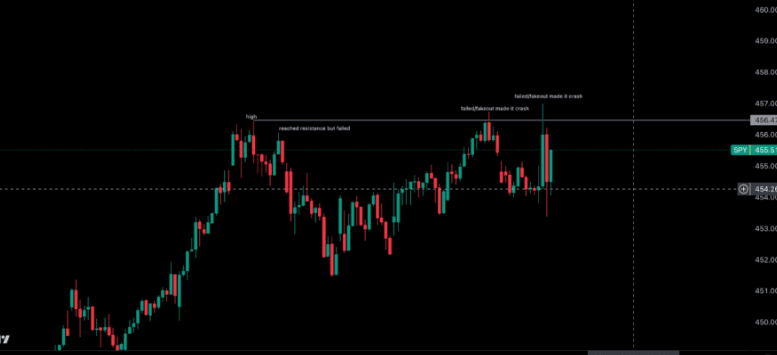
Support and Resistance:
Support & Resistance
– Support and resistance short term > S/R
– Support is under the stock level
– Support = buyers
– Resistance is above the stock level
– Resistance = sellers
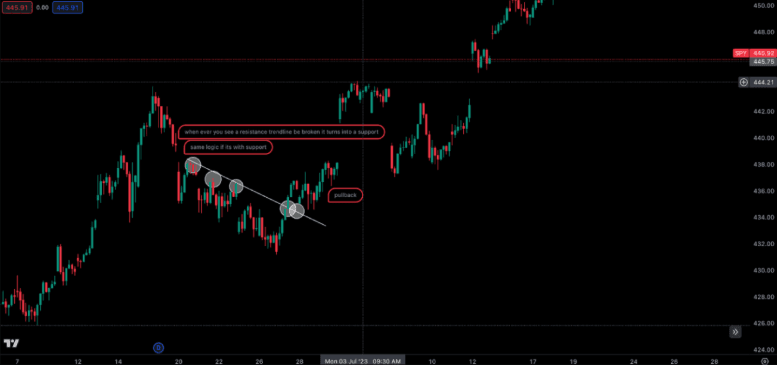
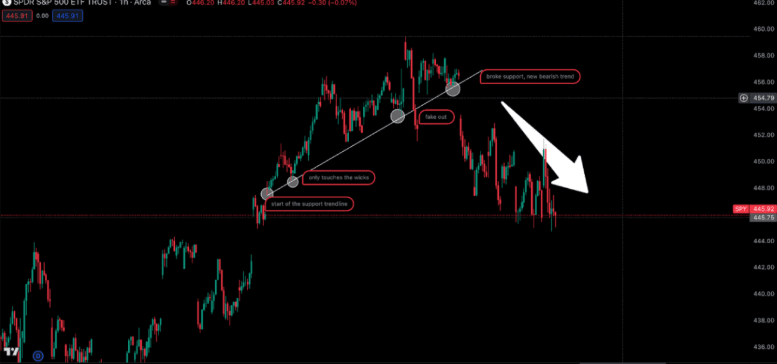
– Once you see broken support it turns into a resistance since its above the stock
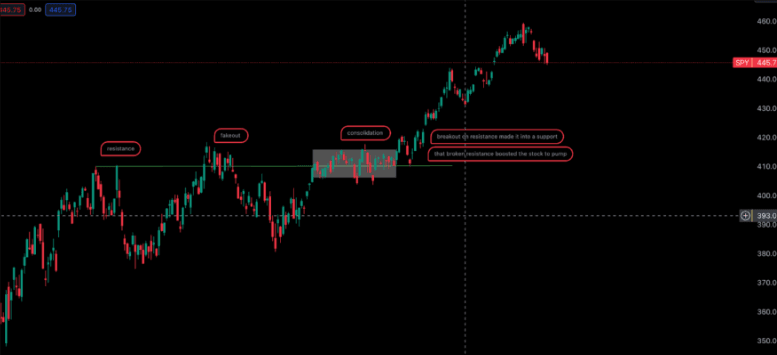
– Once you see broken resistance that turns into a support since it broke above
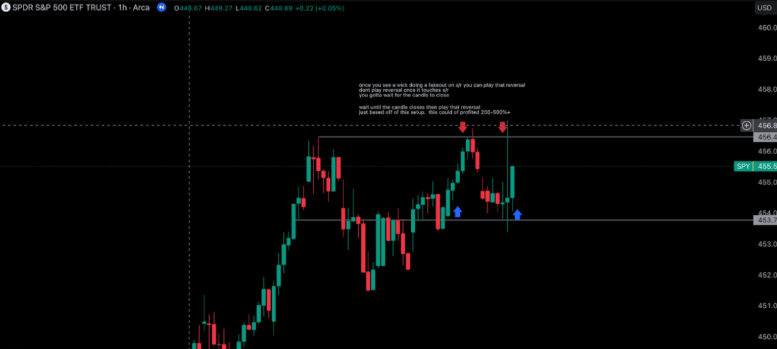
– Whenever you see fake out on S/R the reversal is very strong
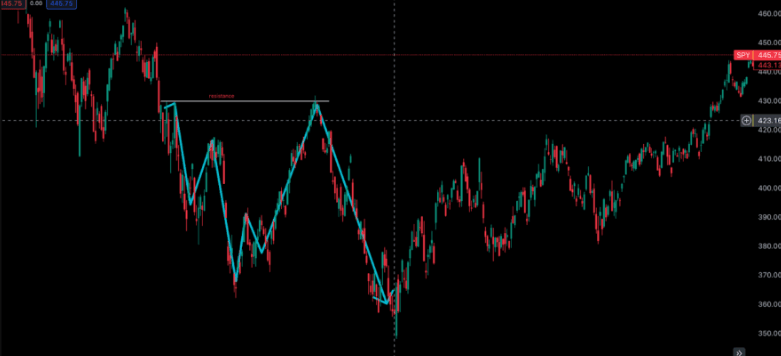
– Support is the peak of the pullbacks low will explain in the photos
– Resistance is the peak of the pullbacks high will explain in the photos
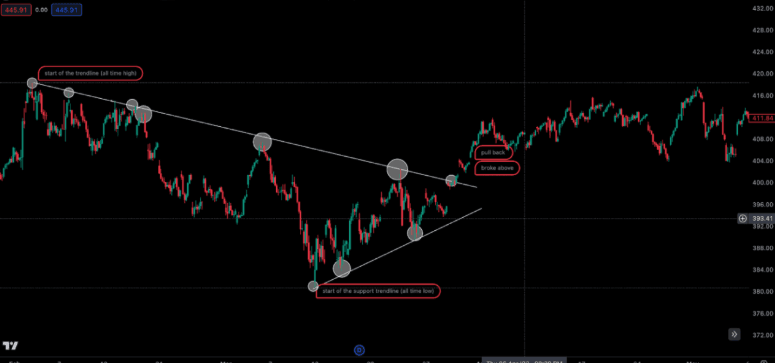
– Resistance is all time high
– Support is the bottom of reversals
– Support is at all time low
– Resistance is the high of pullbacks
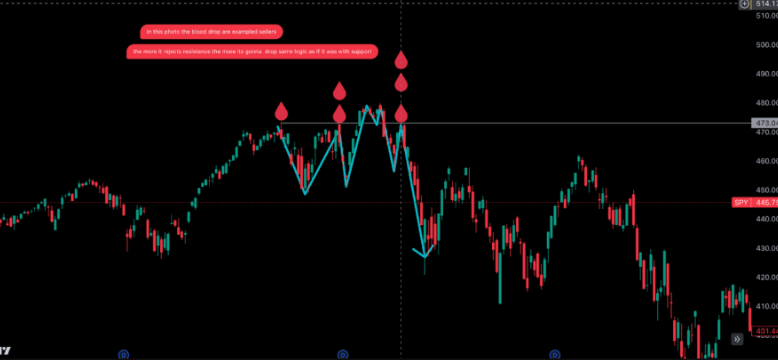
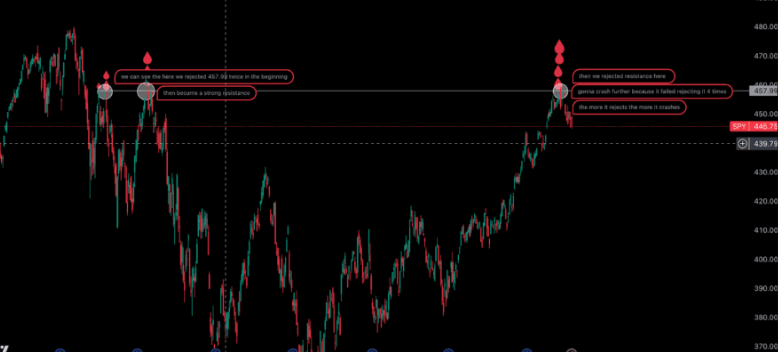
– The more the stock fails breaking s/r the stronger the sellers/buyers are at in the zone
– A s/r will be broken after 2-3+ touches it is rare for a s/r be broken in less than 2 touches in the hourly
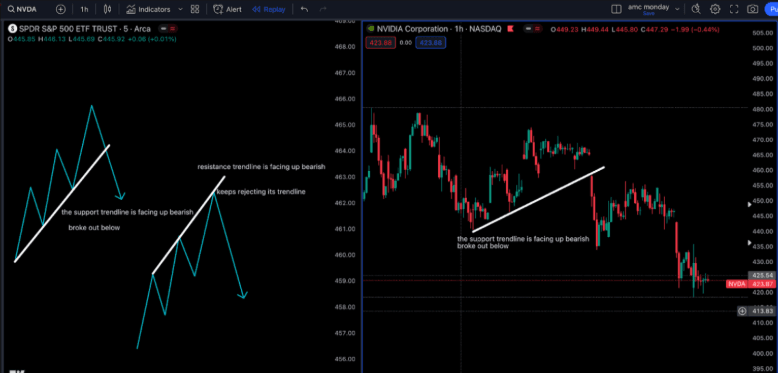
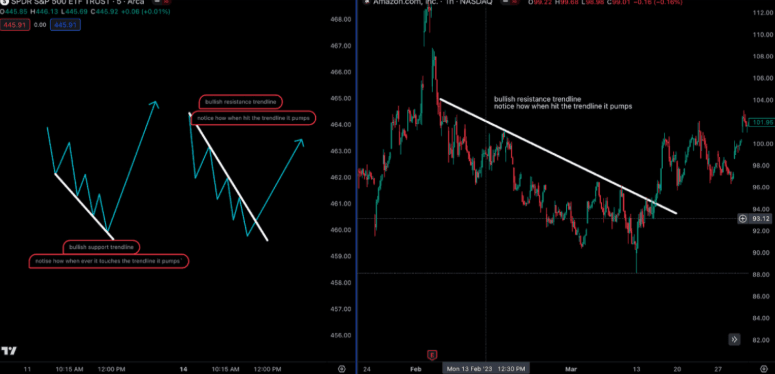
Bearish Trendline:
– There easy to understand and very useful when trading in the smaller time frames
– You don’t need to wait to enter pullbacks for this type of lesson you can enter whenever
– you see it reject off that trendline
– Bullish trend lines are the exact same thing but in reverse
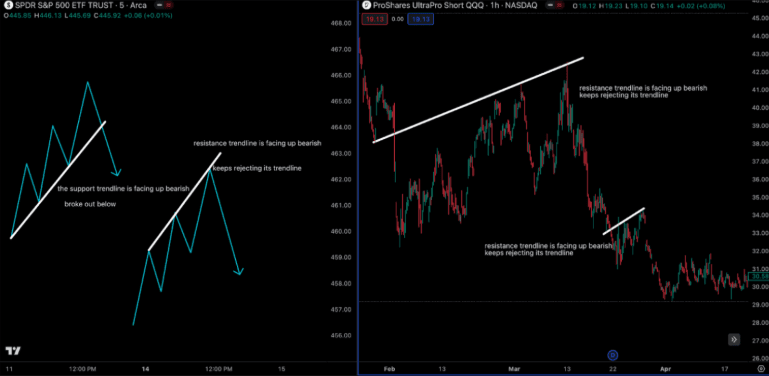
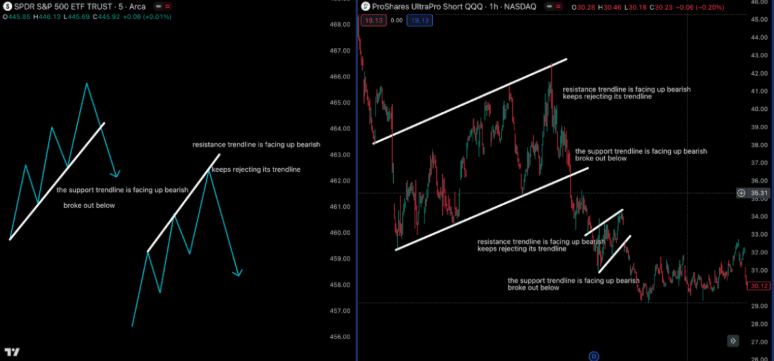
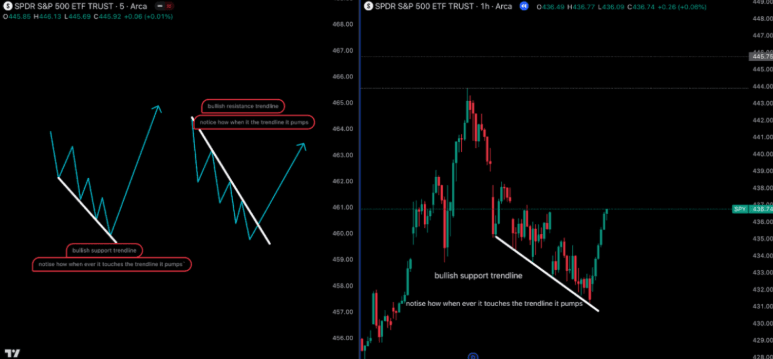
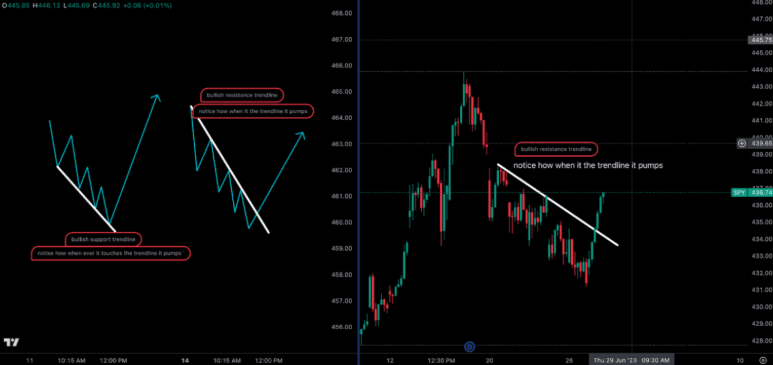
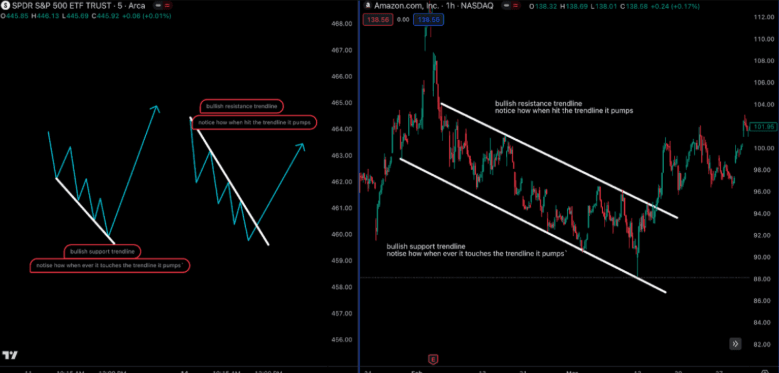
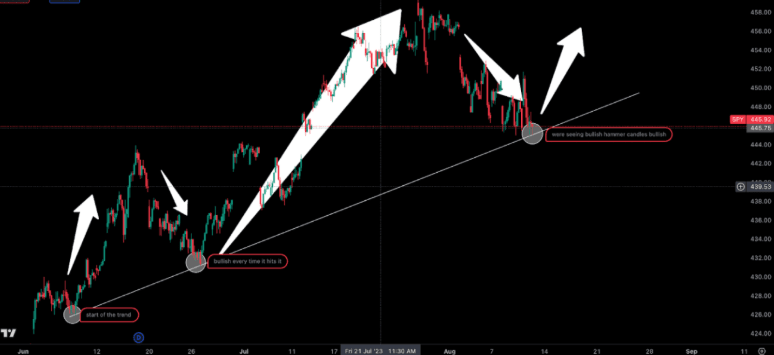
Bullish Trendlines:
– There are 4 types of trendlines all together
– It is important to tell the difference bullish and bearish trendlines
– There 2 types of support trendline and 2 types of resistance trendline
– This channel will be about 1 bullish trendline in support and 1 bullish type in resistance
– There easy to understand and very useful when trading in the smaller time frames
– You don’t need to wait to enter pullbacks for this type of lesson you can enter whenever
– you see it reject off that trendline
– Bearish trend lines are the exact same thing but in reverse
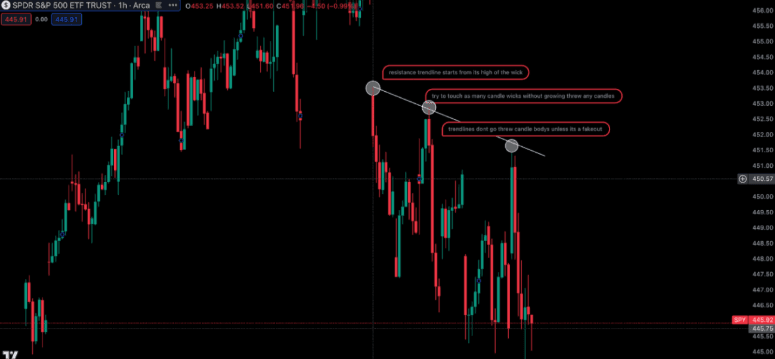
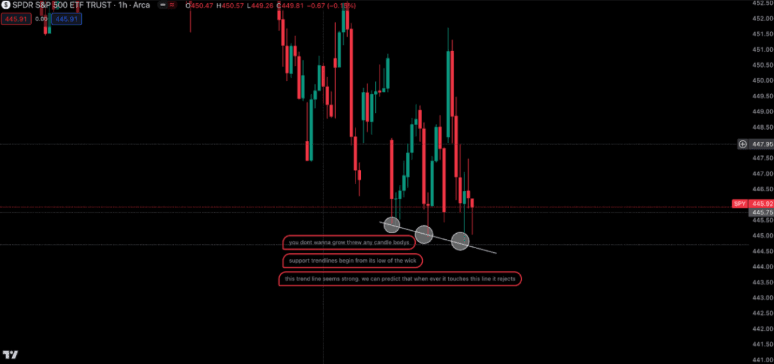
Drawing Trendlines:
– Trendlines are the 3rd most important thing people should learn when learning the basics
– Support Trend Lines start from the bottom low of the wick
– Resistance trendline starts from the high of the candle wick
– Trend lines normally begin when a stock reverses or when it makes a new trend
– Trend Lines shouldnt be used in a chop zone
– Trendlines works best in a large timeframe
– Trendlines are is like s/r but in an angle
– Steep trend lines are easily broken
– Trendlines are invalid if it goes threw candle bodies unless its a fakeout
Candle Sticks:
– Candle sticks are the most important thing people should learn when trading.
– The image below shows you how to read candlesticks
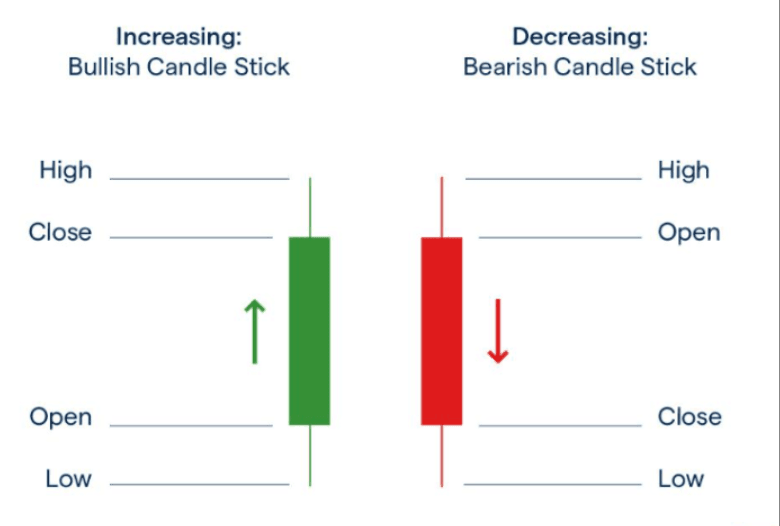
– When learning candlesticks there 4 types of candles you need to learn
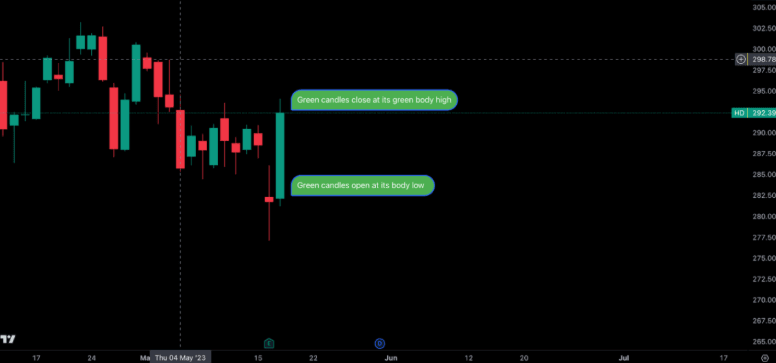
- Body Green candle
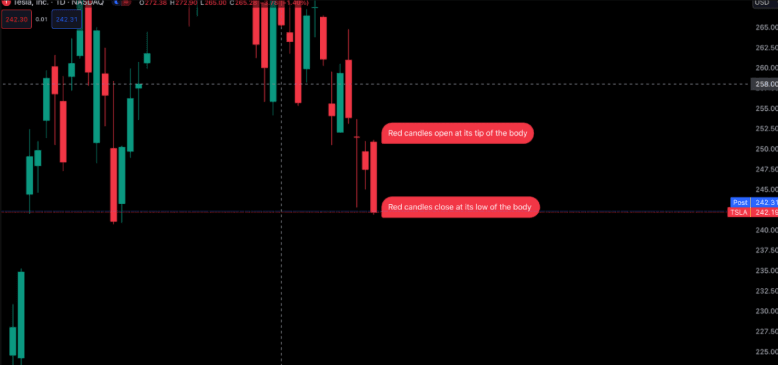
- Red body candle
– Explained G/R body candles above
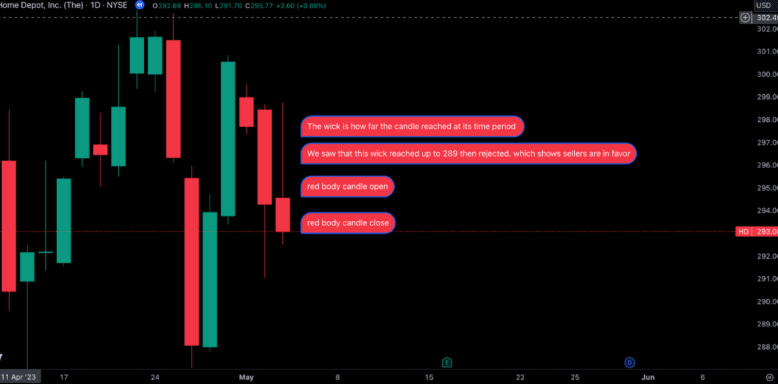
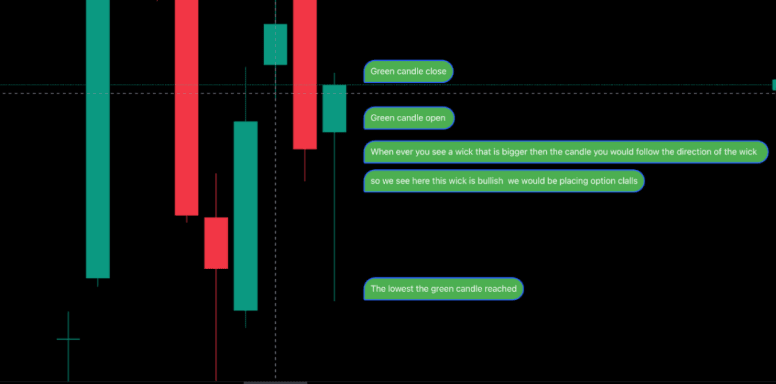
– Green body candle wicks
– Red body candle wicks
– Explained G/R candle wicks below
Trading Terms
Market Hours: In the United States, the stock market opens at 9:30 AM EST. and closes at 4 PM EST. on a standard weekday Monday-Friday.
Extended Hours Trading: Pre-Market trading begins at 4 AM EST. before market open and After-Hours trading takes place after market close until 8 PM EST.
Buy: Buying shares to have a position in a company
Sell: Getting rid of the shares you own to take profits or to sell thinking a stock may fall
Ask: Ask is what people who are looking to sell their stocks are looking to get for their shares
Ask-Bid Spread: Spread is the difference between what people want to spend and what people want to get.
Ticker: Other words for a Stock Symbol – 1-3 Letter Symbol to represent a company trading on the Stock Market
Bull: A bull market is a market condition where investors are expecting prices to rise (Use Bullish as a term to represent how a ticker/chart appear)
Bear: A bear market is a market condition where investors are expecting prices to fall (Use Bearish as a term to represent how a ticker/chart appear)
PT: Price Target set as a trader’s goal to achieve when entering a position
SL: Setting an activation price for a stock to be sold if it dips to, or below that selected price. (A way to protect yourself, a safety net to protect from selloffs on stocks
Volume: The number of shares being traded (Above-Average volume is always watched for)
Broker: An Online Trading Platform to Buy/Sell Stocks on.
Scalp: Also known as a Day-Trade (Quickly getting in and out of a stock)
Short Swing: Buying a stock to hold throughout the day typically an overnight position expecting it to increase over time
Long Swing: Buying a stock at an entry and holding for weeks or months
Squeeze: A squeeze occurs when a stock or other asset jumps sharply higher, forcing traders who had bet that its price would fall to buy it in order to forestall even greater losses. Their scramble to buy only adds to the upward pressure on the stock’s price
Averaging Down: This is when an investor buys as the stock goes down so as to increase the price at which purchased
Float:This is the number of shares which can be actually traded after deducting the shares held by insiders (Low-Float are good indicators for Penny Tickers)
NHOD: New High of the Day (HOD: High of the Day)
Volatility: Means how fast a stock moves up or down
Dividend: Portion of the companies earning which is paid to the shareholders Portfolio: A collection of investments owned by you
Margin: Margin account lets a person to borrow money from the broker to buy shares.
Sector: A group of stocks in the same group Ex. EV Sector, Biotech Sector, Cannabis Sector, Entertainment Sector, etc.
BTO: Buy to open
STC: Sell to close
Exchange: An exchange is a place where different types of investment are traded (Dow Jones or DOW, S&P 500 or SPY, NASDAQ are examples)
IPO: Initial Public Offering that happens when the private company becomes a publicly traded company
Secondary Offering: This is another offering in order to sell more stocks and to raise more money from the public (IPO’s are solid, Secondary Offerings are not good)
Limit Buy: Buying at the exact share price set in the order and will not grab at any higher
Market Buy/Sell Order: Buying/Selling in the open market (May purchase at higher price then intended but does help if wanting to just get in and not miss out on a stock)
RS: Reverse split, worse thing that can happen to a stock in the short term where a company does not meet requirements to stay listed as is on the exchange. When a meeting undergoes, and a stock is denied of a RS it usually is a good thing.
VWAP: Volume-weighted average price
EMA: Exponential Moving Average
SPAC: Special Acquisition Company (Popular Tickers/Mergers)
EBITDA: Earnings Before Interest, Taxes, Depreciation, and Amortization. This metric is used to evaluate a company’s operating performance. It can be seen as a proxy for cash flow. In finance, the term is used to describe the amount of cash (currency) that is generated or consumed in a given time period.
Blue Chip Stocks: The stocks that are behind industry leading companies. These companies offer stable dividends and usually are managed very well financially. Examples include Apple, Microsoft, and Facebook.